Lab 02 – Exploring Possibilities
Card Sorting Lab
What are we doing in lab today?
In this lab, we will practice card sorting, a common method in Human–Computer Interaction (HCI) and User Experience (UX) design. Card sorting is used to explore how users naturally group and label information or functions. By practicing this method, you will gain insights into how people might navigate and understand your interface.
Some information about card sorting if you’re interested:
https://www.experienceux.co.uk/faqs/what-is-card-sorting/
Today’s work connects your first lab — Imagining Futures — into something more concrete: an initial information structure for your project.
You will work in your group. Each group will:
- Generate cards (representing potential features, data, or functions).
- Sort the cards individually and then together as a group.
- Reflect on what the sortings tell you about designing usable systems.
- Draft a simple information architecture diagram.
You should still focus on the course’s final project contexts: Health, Disaster/Emergency Management, Digital Archives, or Play.
Get setup with Figjam
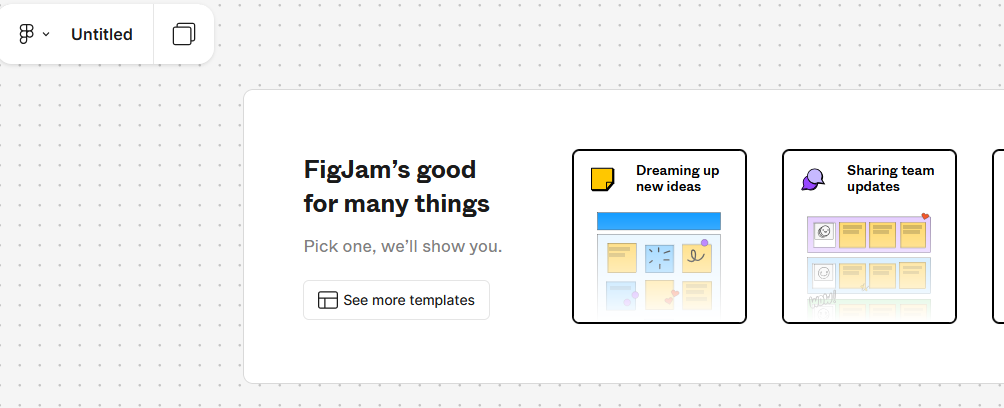
After you have successfully registered for Figma and gotten verified for an educational license, use the Figma invite link on the course Canvas page and use FigJam (free interactive online whiteboard) with your team. (10 min)
01: Generating Cards
Your group will begin by identifying functions or information items that an interface might require in your chosen domain.
Tasks:
(1) After using the Figma Invite link for the IE 418 team, create a new Project with your Final Project Group name as the project name.
- Within this new project, create a new FigJam that you will use to record ideas as a group.
- Note that the templates can be very useful here!
(2) First, Individually identify at least three situations/problems that interest you within an existing digital interface (within your final project context), and write them down in your FigJam. (15–20 min)
- (Note: This section should be within your topic, but may or may not be related to the first lab results—don’t limit your thinking.)
Example:
Situation:
“As a student, I try to keep my sleep and study habits in an Excel spreadsheet, but it doesn’t work well. I can’t always infer how poor rest patterns affect my ability to focus and perform in class based on what I’m able to record in the time I have.”Potential interface: I imagine a mobile app interface where I can log daily sleep hours, receive feedback on how sleep patterns relate to study performance, and get recommendations for healthier routines.
- Group discussion: integrate findings to reach a consensus. Select 2 situations + corresponding actual/potential interfaces. (12 min)
- Briefly share with the class — come up to the front and write down your group’s problems + interface concepts. (1 min per group)
Individually brainstorm at least 5 functions/information items for your 2 concepts. One idea per card in FigJam. (5 min)
Example items: Dashboard showing weekly trends, quick log-in, personalized alerts…
- Group merge: combine items (cards) into a shared deck of 10–15 total items for each concept. (5 min)
What to report:
- Main body of the lab report: fill in your group consensus of 2 situations as well as the combined items (shared deck) of total items
- Appendix: Fill in all individual items that were used for consensus/group combination reported in the main document.
02: Sorting the Cards
Now you will sort cards into categories as a way to reveal potential user mental models.
Tasks:
1) Individually sort the shared deck into categories. (5 min)
- First group the cards into 3-5 categories based on similarity/likeness
Note that how they are similar is not important for the initial grouping - no need for naming yet (all vibes!)
Second, you name the vibes! Based on what seems to be similar, name your categories.
Example (Note: Not prescriptive. Only to give you a general idea of categorization. You might not say this is a good or reasonable classification. Please categorize them based on your own judgment.)
- Logging
- Log daily sleep hours
- Note bedtime and wake-up time
- Track study session hours
- Record focus level
- Quick-entry “log now” button
- Feedback
- Dashboard of weekly sleep trends
- Dashboard of study/focus trends
- Comparison chart: sleep vs study performance
- Guidance
- Personalized recommendations
- Alerts for bedtime reminders
- Alerts for study breaks
- Sharing
- Export summary (PDF/CSV)
- User profile/settings
- Logging
2) As a Group compare categorizations, discuss differences, and agree on a final grouped set of categories that make the most sense. Create and label categories clearly. (10 min)
What to report:
- Main body of lab report: Final consensus sort (text).
- Appendix: All individual sorts.
03: Reflecting on the Sortings
After sorting, reflect on why your categories matter.
Tasks (Discussion, 10–15 min):
1) Identify 2–3 categories that seem most important for your design in 2 concepts.
- Why are these categories meaningful? What do they suggest about how future users might think about your interface?
- In both concepts, do you have the chance to reach out to potential users? If so, what plans do you have?
- If you can conduct card sorting with them, what meaning will the results hold? How could they support interface development?
What to report:
- Main body of lab report: Most important categories + reflection on these questions.
- Remember that the genuine thought process matters the most, don’t just auto‑generate text!
04: Mapping toward an Interface Structure
Translate your consensus sort into a simple structural diagram. Use FigJam templates or other mind‑mapping tools.
Tasks:
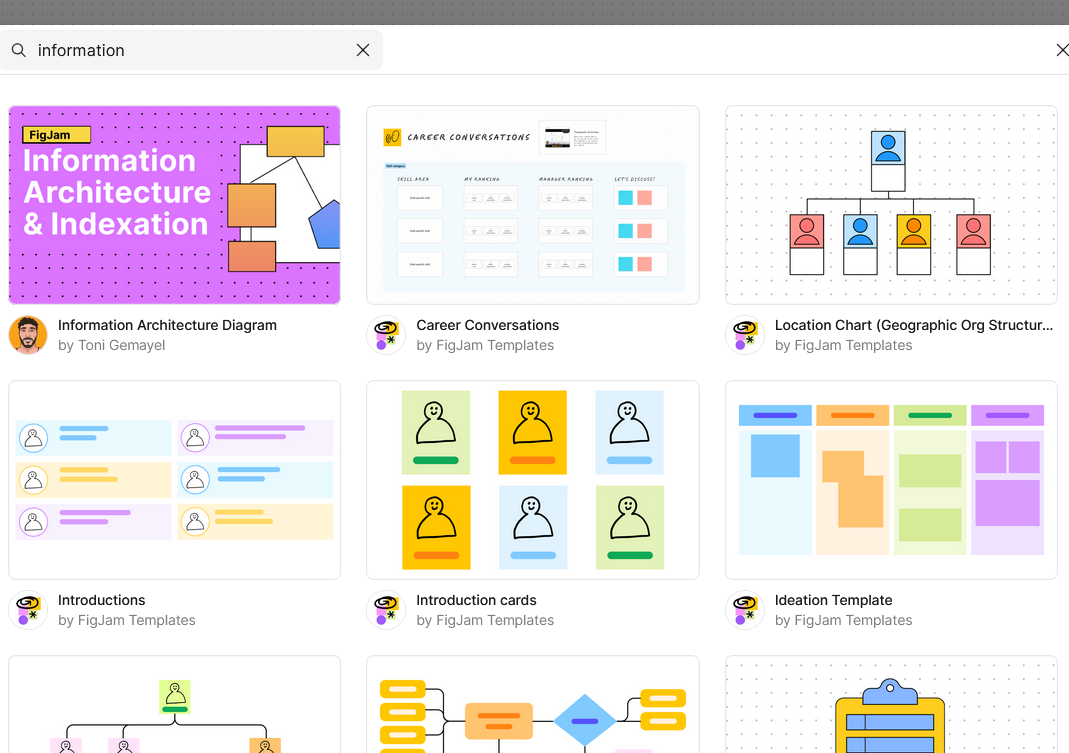
1) Sketch an information architecture:
What is information architecture? https://www.figma.com/resource-library/what-is-information-architecture/
Note: In actual design process, designers’ information architecture diagrams can become highly complex, like the information you see when searching on Google. However, we don’t require you to create a perfect, detailed diagram, but rather a reasonable and concise one.
- Main categories → Subcategories → Individual features.
- Not yet a wireframe, but a draft “map” of how your system could be organized. (10 min)
Example
Main Menu (Transportation)
├── Trip Planning (Choose destination, Route option)
├── In Ride (Chat with driver AI, Emergency button)
└── Payments (Upload card, Split fare)
What to report:
- Main body of lab report: Diagram of your group’s proposed structure.
What is a reasonable lab report length?
- 5–9 pages (excluding appendices).
- Make sure to include all the individual items and work in the Appendices!
How is my lab graded?
| Graded item | Points |
|---|---|
| Introduction | 3 pts |
| Lab section 01 | 6 pts |
| Lab section 02 | 6 pts |
| Lab section 03 | 3 pts |
| Lab section 04 | 3 pts |
| Conclusion & Next steps | 3 pts |
| Appendix 01 (individual raw cards, sorts) | 6 pts |
| Appendix 02 (group photos/screenshots, diagrams) | 6 pts |
Total points possible: 36 pts
Drafted by Winnie Fang and modified by Chris Dancy