LAB 07 - Structures for holding data in Python
In this lab, we will build upon some previous work and also introduce new concepts and libraries so that we can view and manipulate data.
We are going to use a specific type of Database management system called SQLite. I will spare you the specifics of a Database, relational database as you get more of these details in IE 330. Instead we’ll just worry about creating the structures to hold our data in python3.
With this lab, you can test and write code either in visual studio code or colab. You can even create python notebooks directly in VS code if you run the following command in your terminal:
Mac
pip3 install notebook --user
Windows
pip install notebook --user
What will we be submitting?
Ultimately, I will ask you to submit python notebooks (similar to what we’ve done in labs 04 & 05), so no matter what way you choose to test your code, you will be required to submit your code and any responses in a self-contained python notebook (colab). Thus, you should expect to share individual notebooks and one group notebook as you’ve done in the past. Ultimately, you will need to share the link and make sure to give you instructor and TAs edit access.
Part 1: Using the pandas library and dataframes
We’re going to use a python library (module) called pandas for our work today.
What is Pandas and how do I get it?
Pandas is a great general purpose data analysis and manipulation library. It allows you to create several different types of data structures internally (within your python code) and load other data sources into your python code (e.g., an excel spreadsheet). Pandas is useful for purposes such as data analytics and often is a first stop for folks looking to do some general data analysis in python3.
Installing pandas is about as easy as installing many other python3 libraries. You’ll simply need to run the pip (or pip3) install command to grab the library. Within your terminal, you can run the following command:
Mac
pip3 install pandas --user
Windows
pip install pandas --user
Using Colab (or running a jupyter notebook within VS Code?) No problem! You just need to add the following to the top of your notebook:
Colab
!pip install pandas
After you’ve installed your python library, you can access it using the import command:
import pandas as pd
Here, we imported our pandas library and used as pd so that we can access that library by typing pd instead of pandas in our code. As an example, see the code below and spot the differences to see what it means to use as:
with as
my_csv_data = pd.read_csv("my_data.csv")
without as
my_csv_data = pandas.read_csv("my_data.csv")
Using pandas to read in data
Pandas has several methods that you can use to read-in/import data so that it can be read, manipulated, output, etc.
We’re going to go through an example to read in data that will build towrds using sqlite to hold data, but if you want another nice “getting started” tutorial, check out the official one on the pandas site here
Reading in tabular type of data is fairly straightfoward with pandas, you just need to use one of the read commands.
Let’s grab some data to read-in. Download the CSV at this link to your computer
If you are running python directly on your computer, you’ll want to download this file to the same directory as where your lab 07 python files (or jupyter notebook files) are saved.
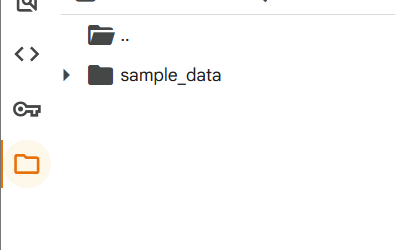
If you are using Colab, you’ll want to click on the folder icon in Colab (see screenshot below) and upload the file there.
Note: In colab, you have to re-upload your data everytime the runtime restarts (those data don’t persist across sessions)
Now that we have our dataset, let’s read it (and do some data manipulation) in using Pandas!
import pandas as pd

# Reading in data, replacing spaces in column names with underscores, & sorting data by year
pa_data = pd.read_csv("Medical_Assistance_Enrollment_PA_Human_Services.csv")
pa_data.columns = pa_data.columns.str.replace(" ", "_")
pa_data = pa_data.sort_values(["Calendar_Year", "Calendar_Month"])

# Filtering for relevant columns
keep_columns = ["Calendar_Year", "Calendar_Month", "Month_Name", "Date", "County_Name", "MA_Individuals", "MA_Children", "State_Fiscal_Year"]
pa_data = pa_data[keep_columns]

# Grabbing data from Centre county
pa_data_centre = pa_data[pa_data["County_Name"] == "Centre"]
As indicated in the comments, we’ve just accomplished a few things with the code above:
1) read in a dataset (the CSV) 2) replaced spaces in column names with underscores 3) sorted those data 4) filtered those data so that we only have a portion of columns 5) and finally filtered those data so that we only have data from Centre County
Take some time to tinker!
You should be doing this either way to understand what’s going on, but it seems a good early time to have you stop, play around a bit, and take a breath!
Now is a good time to pause and tinker around with the code to understand what is going on! Change aspects of the code, print out some things to allow you to understand what’s going on above, open the CSV in excel -> do something (like filter the data by a column value) -> then see if you can reproduce that action in pandas with a slight modification of the code above, etc.
We’ve also just created a new pandas dataframe
When we read in data using the read_csv method, a DataFrame is “analagous to a spreadsheet” and it holds our data in a similar manner (we just have to use methods to access an manipulate data within the dataframe).
We can even convert data in structures like python lists or dictionaries to a dataframe!
*Note: If you are using colab, you don’t need to import pandas each time unless you are running code blocks independently (you only have to import it once within a running session)
# Note that
import pandas as pd

# Create a sample dictionary
sample_dict = {
    "One": (1, 2, 3),
    "Two": (2, 4, 6),
    "Three": (3, 6, 9)
}

# Convert that dictionary to a dataframe
sample_df = pd.DataFrame(data=sample_dict)

# Print the first 5 rows of the dataframe
print(sample_df.head())
🎯 TASK 1: Create a simple dataframe from previous work
Here, we are going to take some code from our previous lab and use it to create a new pandas dataframe. We’re not reading in data here (that will come later), but instead are focused on simple conversion of a data structure that you’ve used previously to a new way to hold those data - Pandas dataframes. Create a new code block to accomplish the following tasks:
Individually:
- Create a new dictionary similar to your previous restaurant focused dictionary, but this one will provide historical context by giving prices across time
- Name the dictionary
menu_history_dict - Give each of the following items 4 prices:
- “Burger”, “Pizza”, “Salad”, “Fries”, “Drink”
- The prices should take the form of
(price1, price2, price3, price3)
- Notice here that the biggest difference from our previous use of a dictionary is now we’re representing the values in our
key:valuepairs with a python tuple of 4 numbers.
- Name the dictionary
- Convert this dictionary to a Pandas dataframe with the name
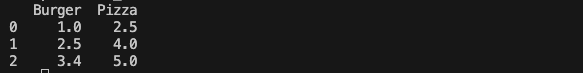
menu_history_df- If you did output your dataframe to make sure things worked as you might expect, you could see output like the screenshot below (but with more menu items and prices):
Group:
- Compare your solutions, reach a consensus, and place that consensus in your group notebook
If you want to know more about dataframes, I would suggest reading the links above, especially this one which compares those pandas data structures to spreadsheets. All that’s important here is that you can create a spreadsheet with data for initial setup, then import it into python using pandas to hold those data for displaying and manipulating those data within your applications/interfaces.
Now, let’s get to another way of holding our data that will last beyond just one session of running python - using a database
Part 2: Using SQLite
In addition to spreadsheets and python dataframes, another useful tool to use is a relational database. Most typically, you’re using some form of structured query language (SQL). A lot of relational database management systems DBMSs use a form of SQL to allow you to read and manipulate data contained in your database.
What you might know (but not realize) is that you’ve technically already created databases of sorts using Excel spreadsheets! You can some of the same things using these spreadsheets, but there are reasons why a DBMS can be useful. You likely have/will go over DBMSs (and databases in general) in IE330, but for now I’ll just give you those terms and allow you to do some self-research if you want to find out more beyond what we explicitly do in this lab.
For this lab, we’re going to introduce and use an intergrated DBMS called sqlite while SQLite isn’t perfect for everything, it can be useful for integrated applications where we don’t want to have to deal with a separate server and aren’t particularly worried about things like security. What’s more, much of what you learn here will transfer to other DBMSs such as MySQL or MSSQL, only those systems will have even more features (and potentially more bloat if you don’t need those features).
Connecting to our Database (and creating it if it doesn’t exist) is typically the first step after deciding what DBMS we are using. What’s useful for us is that sqlite is built-in to python for us to use!:
# We need to import a new library - sqlite3 [https://docs.python.org/3/library/sqlite3.html]
import sqlite3

# Creating a connection to the "pad_data.db" database
pa_db_con = sqlite3.connect("pa_data.db")

# Now we need a cursor that keeps track of where we are in the DB (think of the cursor that you see blinking as you move through these lines of code!)
pa_db_cur = pa_db_con.cursor()

# We're not actually doing anything, so lets go ahead and close our connection
pa_db_con.close()
Now that we are connected to our SQLite DB and have created the cursor, we can look at it and/or manipulate it. We’ll use our pandas df to do this. Let’s move back to the dataset we read in previously:
Reminder that you may not need to reimport these libraries, but we’ll do it here just to make the code work as one unit
import pandas as pd
import sqlite3

# Reading in data, replacing spaces in column names with underscores, & sorting data by year
pa_data = pd.read_csv("Medical_Assistance_Enrollment_PA_Human_Services.csv")
pa_data.columns = pa_data.columns.str.replace(" ", "_")
pa_data = pa_data.sort_values(["Calendar_Year", "Calendar_Month"])

# Filtering for relevant columns
keep_columns = ["Calendar_Year", "Calendar_Month", "Month_Name", "Date", "County_Name", "MA_Individuals", "MA_Children", "State_Fiscal_Year"]
pa_data = pa_data[keep_columns]

# Creating a connection to the "pad_data.db" database
pa_db_con = sqlite3.connect("pa_data.db")

#[https://pandas.pydata.org/pandas-docs/stable/reference/api/pandas.DataFrame.to_sql.html]
# Adding the medicare dataframe to the pa_db_con database as table
pa_data.to_sql("pa_medicare", pa_db_con, if_exists="replace")

# Now we need a cursor that keeps track of where we are in the DB (think of the cursor that you see blinking as you move through these lines of code!)
pa_db_cur = pa_db_con.cursor()

# Place cursor on table and grab all columns/attributes and rows where county name is Centre.
centre_data = pa_db_cur.execute("SELECT * FROM pa_medicare WHERE County_Name=\"Centre\"")
centre_data_db_rows = centre_data.fetchall()


num_rows = len(centre_data_db_rows)
for i in range(num_rows):
  print(centre_data_db_rows[i])
  if (i > 5):
    break

new_df = pd.read_sql("SELECT * FROM pa_medicare WHERE County_Name=\"Centre\"", pa_db_con)
print(new_df.head())
pa_db_con.close()
🎯 TASK 2: Comment that code!
Individually:
- Fill in the unfilled comments on the two code blocks below (all places that say “comment here”)
- Place code blocks with completed comments in your individual python notebook
Group:
- Compare your solutions, reach a consensus, and place that consensus in your group notebook
- After your two code blocks, create a text block with the title #Discussion# and answer the following questions:
- Were there any disagreements? If so, what were they?
- What parts of the code were the most confusing to members of the group and why do you think the confusion occured?
You comments should adequately explain what the code below it does with reasonable context where needed
Don’t always understand what code does just by looking at it? (Join the club!) Try running it and tinkering with it to see what changes, prints, etc. accomplish
Code Block 1
import pandas as pd
import sqlite3

# Reading in data, replacing spaces in column names with underscores, & sorting data by year
pa_data = pd.read_csv("Medical_Assistance_Enrollment_PA_Human_Services.csv")
pa_data.columns = pa_data.columns.str.replace(" ", "_")
pa_data = pa_data.sort_values(["Calendar_Year", "Calendar_Month"])

# Filtering for relevant columns
keep_columns = ["Calendar_Year", "Calendar_Month", "Month_Name", "Date", "County_Name", "MA_Individuals", "MA_Children", "State_Fiscal_Year"]
pa_data = pa_data[keep_columns]

#
pa_db_con = sqlite3.connect("pa_data.db")

#
pa_data.to_sql("pa_medicare", pa_db_con, if_exists="replace")

# Now we need a cursor that keeps track of where we are in the DB (think of the cursor that you see blinking as you move through these lines of code!)
pa_db_cur = pa_db_con.cursor()

# Place cursor on table and grab all columns/attributes and rows where county name is Centre.
centre_data = pa_db_cur.execute("SELECT * FROM pa_medicare WHERE County_Name=\"Centre\"")
centre_data_db_rows = centre_data.fetchall()

#
num_rows = len(centre_data_db_rows)

#
for i in range(num_rows):
  print(centre_data_db_rows[i])
  if (i > 5):
    break

#
new_df = pd.read_sql("SELECT * FROM pa_medicare WHERE County_Name=\"Centre\"", pa_db_con)

#
print(new_df.head())

#
pa_db_con.close()
Code Block 2
#Comment here
import pandas as pd
import sqlite3

def open_my_conn(my_db_name):
    """Comment here (what does this function do?)"""

    new_db_conn = sqlite3.connect(my_db_name)
    new_db_cur = new_db_conn.cursor()

    return (new_db_conn, new_db_cur)

def apply_my_sql(sql_str, my_db_cur):
    """Get SQL String, apply that SQL string statement to a specified database using cursor, and return the output"""

    output_data = my_db_cur.execute(sql_str)

    return (output_data)

def csv_to_db(my_csv_file_name, my_table_name, my_db_conn):
    """Comment here"""

    my_data = pd.read_csv(my_csv_file_name)
    my_data.columns = my_data.columns.str.replace(" ", "_")

    # Comment here
    my_data.to_sql(my_table_name, my_db_conn, if_exists="replace")

def print_out_db_data(db_data, num_rows):
    """Comment here"""

    db_data_rows = db_data.fetchall()

    # Comment here
    for i in range(num_rows):
        print(db_data_rows[i])

def sql_to_df(my_db_conn, my_sql_stmt):
    """Convert output of SQL Statement to new dataframe and return dataframe"""

    my_new_df = pd.read_sql(my_sql_stmt, my_db_conn)
    return (my_new_df)

def close_conn(my_db_conn):
    """Comment here"""
    my_db_conn.close()

# Open a new database connection (and create a new database if it doesn't exist)
(pa_db_conn, pa_db_cur) = open_my_conn("pa_data_db.db")

# Comment here
csv_to_db("Medical_Assistance_Enrollment_PA_Human_Services.csv", "pa_medicare", pa_db_conn)

# Comment here
centre_data = apply_my_sql("SELECT * FROM pa_medicare WHERE County_Name=\"Centre\"", pa_db_cur)

# Comment here
print_out_db_data(centre_data, 10)

# Comment here
union_df = sql_to_df(pa_db_conn, "SELECT * FROM pa_medicare WHERE County_Name=\"Union\"")

# Comment here
close_conn(pa_db_conn)
🎯 TASK 3: Get some other data from the dataset!
For this task, I want you to read the same dataset, and retrieve some other data. First we’ll use only the dataframe structure to hold our data, then we’ll expand and use an sqlite database as well. Note that tasks 3.1 and 3.2 should be in two different code blocks with the assumption that the second code block is dependent on the first running before the second.
Task 3.1: Using a Pandas Dataframe
Individually:
- read in the dataset into a dataframe
- Filter out the dataset so that you are only dealing with the following columns:
- [“Calendar_Year”, “Calendar_Month”, “Month_Name”, “Date”, “County_Name”, “MA_Individuals”, “MA_Children”, “State_Fiscal_Year”]
- Grab the data only from the following counties using the dataframe object:
- “Union”, “York”, “Berks”
- Here, we want each of these counties individually (separate sets of data for each county)
- *Hint - Check the previous example code for an idea of how to do this!
- Print out the first five rows of of those data
- The dataframe head method may be useful here, but there is more than one way to accomplish this
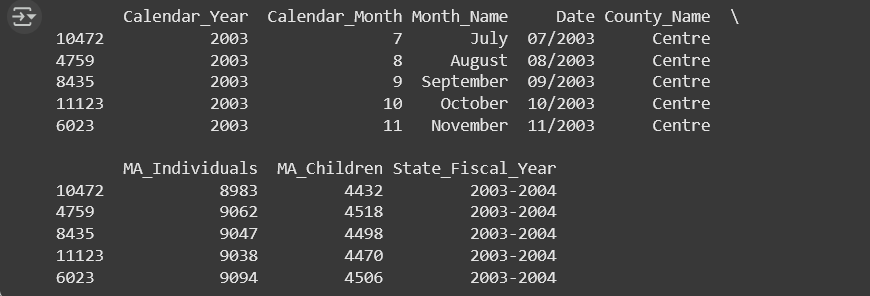
- Your outputs likely will look similar to the examples below:
Group:
- Compare your solutions, reach a consensus, and place that consensus in your group notebook
Task 3.2: Expanding to use sqlite
Now lets accomplish the same task, using sqlite! Accomplish the following tasks by adding to the code you just created.
- Use sqlite to create a new DB with the name
pa_info.db - Use your already created dataframe from task 3.1 to create a new table named
pa_medin a database with the namepa_info.db - Use SQL to grab all the rows from the database
WHEREthe County name is one of three counties:- “Union”, “York”, “Berks”
- As with 3.1, we want each of these counties individually (separate sets of data for each county)
- *Hint - Check the previous example code for an idea of how to do this!
- Print out the first five rows of of those data
- *Hint - Check the previous example code for an idea of how to do this!
- Your outputs likely will look similar to the example output below:

🎯 TASK 4: Lets try this out with some new data!
For this final task, you will be finding a dataset related to your final project topic and interface.
Individually:
- Find a potential dataset to use that relates to your final project topic and tasks that directly relate to your interfaces (old or new)
- Here, we mean a dataset that has an impact on the interface itself (whether directly via information displayed and/or via function that will impact the interface)
- Every group member should have a unique dataset
- Can’t find a good one? You can create one if it makes sense (it should be related data for your topic/tasks, but something you’ve constructed into a tabular form of an excel spreadsheet and/or CSV)
- Similar to task 3.1/3.2, load your data into a pandas dataframe and an SQLite db, then print out the first five rows of those data (you can filter if/as it makes sense)
Group:
- Compare your solutions, reach a consensus on which is the most appropriate dataset and code to use, and place that consensus code in your group notebook.
- After your consensus code block, create a text block with the title #Discussion# and answer the following questions:
- Why did your group select the dataset and code chosen?
- What parts of the code were the most confusing to members of the group and why do you think the confusion occured?
- Where and how might you use your dataset in a new (QT-based) interface?
Deliverables
Three sets of files need to be submitted:
- Individual Colab notebook (.ipynb link) containing:
- Tasks 1-4
Individual datasets from task 4
- Group Colab notebook (.ipynb link) containing:
- Consensus solutions for Tasks 1-4
- Group reflection discussion
Important reminders:
- Code in Colab notebook should run without errors
- Have code that doesn’t work? To reduce the potential for an extra penalty, comment that code out and include a comment on what you were trying to do and what error you saw
- Include comments explaining your logic
- All files should be shared with your instructor and TAs with edit access
📊 Grading Rubric
| Graded Item | Points |
|---|---|
| Individual Task 1 | 3 pts |
| Individual Task 2 | 3 pts |
| Individual Task 3 | 3 pts |
| Individual Task 4 | 3 pts |
| Group Task 1 Consensus code | 3 pts |
| Group Task 2 Consensus code | 3 pts |
| Group Task 2 Consensus discussion | 3 pts |
| Group Task 3.1 Consensus code | 3 pts |
| Group Task 3.2 Consensus code | 3 pts |
| Group Task 4 Consensus code | 3 pts |
| Group Task 4 Consensus discussion | 3 pts |
| Group - Collaboration & Organization | 3 pts |
Total Points: 36 pts