Lab 09 – Understanding Human Interaction with Interface through Eye‑Tracking Data
What are we doing in lab today?
- Understand foundational metrics in eye‑tracking research.
- Learn how to visualize gaze data using Python.
- Interpret gaze heatmaps to evaluate interface design.
- Suggest design improvements based on empirical evidence.
- Engage with external eye‑tracking resources for future work.
As with many previous labs, this lab mixes individual and group work. But you must share and discuss the results of Parts 3 and 4 with your group members and collaboratively write the report for these Parts.
For the remaining parts, you must draw individual conclusions and incorporate all individual thinkings into the lab report (bot merge them, but list them).
We will use Jupyter (python) notebooks (what is used for Google colab) for reports so that you can more easily submit your code with your text. In the sections with code below, we explain the task with the assumption that you are using VS code (or a similar IDE) to actually run, and tinker with your code.
- In a bit of a break from past labs, you will only submit your group colab notebook (which will have individual contributions).
- Note that you still can work on individual files, you just will not submit those files and will need to coordinate to merge your individual contributions into one document!
Tasks from each section should be clearly demarcated with a Text box that indicates the section (e.g., # Part 01)
Part 01: Learn the Basics: Eye‑tracking Metrics
Your group will begin by identifying functions or information items that an interface might require in your chosen domain.
Explore to understand: Visit the provided learning links, explore them.
Eye Tracking: The Ultimate Guide for UX & UI Designers: https://www.cursorup.com/blog/eye-tracking [Some high-level things about eye-tracking]
The danger of relying on opinion—uncover the truth with eye tracking : https://www.tobii.com/blog/the-danger-of-relying-on-opinion [Why you might eye-track]
What the AOI?! : https://www.tobii.com/blog/what-the-aoi [Understanding AOI]
How to choose the right eye tracker for your research — the all-in-one guide: https://www.tobii.com/blog/how-to-choose-the-right-eye-tracker [Understanding types of eyetrackers]
User testing with eye tracking goes mobile: https://www.tobii.com/blog/user-testing-with-eye-tracking-goes-mobile [Mobile interfaces and eye-tracking]
Expert eye tracking tips: https://www.tobii.com/blog/expert-eye-tracking-tips [Some pitfalls of eye tracking]
Eye tracking example - football: Getting an edge on the field: https://www.tobii.com/blog/eye-tracking-in-football [An application]
Explore what kind of metrics might be used in eyetracking: https://connect.tobii.com/s/article/understanding-tobii-pro-lab-eye-tracking-metrics?language=en_US
Tasks
Answer/Address the following questions individually, then place your individual answers into your group notebook.
- In your own words, answer the following questions:
- What is a fixation?
- What is a saccade?
- What is an Area of Interest (AOI)?
What are five common metrics used in eye‑tracking (e.g., saccade amplitude)? Describe each metric identified
How could eye‑tracking help in your project, if it is possible? (reflection)
- Which metrics might be useful for your current project, if you want to test the usability of your design? (reflection)
What to report:
Place answers to the above questions in your group python notebook.
Part 02: Visualize Synthetic Webpage Eye‑Tracking Data
With this section, you will move towards translating knowledge into practical skills:
- Visualizing how users’ gaze densities reveal attention flow on a web interface.
- Learn to plot, visualize gaze coordinates to create a usable heatmap aligned with interface layout.
Heatmap: What and why https://contentsquare.com/guides/heatmaps/ [You can find more heatmap-related content in the top navigation bar of this website.]
The common way to create heatmap:
- you have a data export from your eyetracker and its corresponding sofetware.
- the data can include the gaze point coordinates, along with numerous related metrics
- use some Use some heatmap creation tools (which can be commercial software or open-source plugins)
- we are going to use the library named matplotlib in python to help us create heatmap
Prepare for task:
- You have created a folder in your computer for today’s lab (or a folder store all your lab files)
- Download the files in this Onedrive link and put these files in your lab folder:
image of a webpage
eye-tracking dataset
If you have issues with these links, use this sharepoint folder link
- You have VS code and have installed the python 3.12 (go to the relevant help page if you are using your personal computer and don’t have it)
- Open your VS code, open your lab folder in your VS code, create a new (.py) file to run the task
- Install following python libraries in your VS code terminal a. If when you want to run a python file, you type
python(likely Windows)pip install pandas seaborn matplotlib numpy openpyxlb. If when you want to run a python file, you type
python3(likely Mac)pip3 install pandas seaborn matplotlib numpy openpyxl - Verify everything has installed correctly locally - If you see the ✅ confirmation, proceed: a. If when you want to run a python file, you type
python(likely Windows)python -c "import pandas, seaborn, matplotlib, numpy, openpyxl; print('✅ Environment ready.')"b. If when you want to run a python file, you type
python3(likely Mac)python3 -c "import pandas, seaborn, matplotlib, numpy, openpyxl; print('✅ Environment ready.')"
Some useful terminal commands
Note that if you’ve been using
python3to run commands/files, you would still usepython3here!
python --version
#Or
python -V
#may output: Python 3.12.12
check current python path
where python   # Windows
which python   #macOS/Linux
Tasks:
- Put the following code into your python file (save it!)
Note: Sometimes just copy and pasting can produce odd spacing errors with Python, so be on the lookout for that as a potential issue (and type directly into your editor if need be!)
   # ---------- Visualize Eye-Tracking Heatmap (from Excel) ----------
   import pandas as pd
   import seaborn as sns
   import matplotlib.pyplot as plt
   from matplotlib import image as mpimg
   from matplotlib.colors import LinearSegmentedColormap

   # ========= Step 1. Load data and background image =========
   # Read the gaze data (X, Y coordinates, and duration weights) from Excel
   # Ensure that 'gaze_data.xlsx' exists in the same directory as this script.
   data = pd.read_excel("gaze_data.xlsx", sheet_name="Synthetic_Gaze")

   # Read the background interface image that will serve as the base of the heatmap
   bg = mpimg.imread("webpage.png")

   # Record the image width and height for correct alignment with gaze coordinates
   width, height = bg.shape[1], bg.shape[0]

   # ========= Step 2. Define a smooth, perceptually natural color map =========
   # The color progression (blue → cyan → green → yellow → red)
   # represents increasing gaze intensity or duration.
   heat_cmap = LinearSegmentedColormap.from_list(
      "heat_eye_smooth",
      [
         (0.00, "#0033FF"),   # Blue - lowest attention density
         (0.25, "#00FFFF"),   # Cyan - lower–mid density
         (0.50, "#00FF66"),   # Green - mid density
         (0.75, "#FFFF33"),   # Yellow - higher density
         (1.00, "#FF0000")    # Red - highest attention density
      ],
      N=256
   )

   # ========= Step 3. Adjustable parameters for students =========
   # These two parameters allow students to explore how visualization settings
   # alter the perceived "focus" and spread of visual attention.
   bw = 0.35      # Bandwidth adjustment: controls the spread/smoothness of hotspots
   alpha = 0.70   # Transparency of the heatmap overlay (0 = fully transparent, 1 = opaque)

   # ========= Step 4. Plot the heatmap over the webpage image =========
   # Create the plotting canvas with a wide aspect ratio for clarity.
   fig, ax = plt.subplots(figsize=(14, 7))

   # Display the webpage background image first (base layer)
   ax.imshow(bg, extent=[0, width, height, 0])

   # Draw the kernel density–based heatmap using Seaborn.
   # The color density represents the duration-weighted frequency of gaze points.
   sns.kdeplot(
      data=data,
      x="GazeX", y="GazeY",
      weights=data["Duration_ms"],   # Use gaze duration as weighting
      fill=True, thresh=0.05, levels=150,
      cmap=heat_cmap, alpha=alpha, bw_adjust=bw, ax=ax
   )

   # Set axis limits to match the image dimension
   ax.set_xlim(0, width)
   ax.set_ylim(height, 0)

   # Remove the axes and ticks for cleaner visualization
   ax.axis("off")

   # Add a descriptive title including the adjustable parameters for traceability
   ax.set_title(
      f"Eye-Tracking Heatmap (bw={bw}, alpha={alpha})",
      fontsize=15, weight="bold"
   )

   plt.tight_layout()   # Reduce excess white margins
   plt.show()
In your terminal, execute the code
a. If when you want to run a python file, you type
python(likely Windows)python [yourfilename].pyb. If when you want to run a python file, you type
python3(likely Mac)python3 [yourfilename].pyReminder: this is the equivalent to pressing the play button in the upper-right corner, but the advantage of executing it in the terminal is that when you have multiple environments in the future, you will always clearly know in which environment you are running your code.
Try changing the bandwidth and transparency, and the colour of the heatmap, can you make it more unique or more affectively pleasing?
After getting the heatmap, reflect by answering the following questions:
- Which regions of the webpage show the strongest heat concentration? Why do you think this is the case?
- Could color or layout cause glance inefficiencies?
- If you are a web designer, what design recommendations could you infer from the heatmap?
What to Report:
The following should be placed into individual sections on your group jupyter notebook. Note that you likely will need to work within your own notebook before integrating the information into the group notebook
- The heatmap you generate from default py file [Only need one of these]
- Your unique heatmap after you modify the py code [Individual]
- Your reflection on task 4 [Individual]
Part 03: Design Improvement Through Evidence
Translate analytical results into redesign decisions, this is how engineers and UX researchers link quantitative measurement with qualitative improvement.
Note that you should complete this task as a group. Communicate and come to a consensus for this work. For task 2, we would suggest that you split into 2 groups (if a group of 4) and design the prototype independently, then come to a consensus on which you’ll use in your report.
Tasks:
- Review your Part 2 findings. Propose three or more design tweaks (e.g., relocate a button, adjust text hierarchy, modify image contrast).
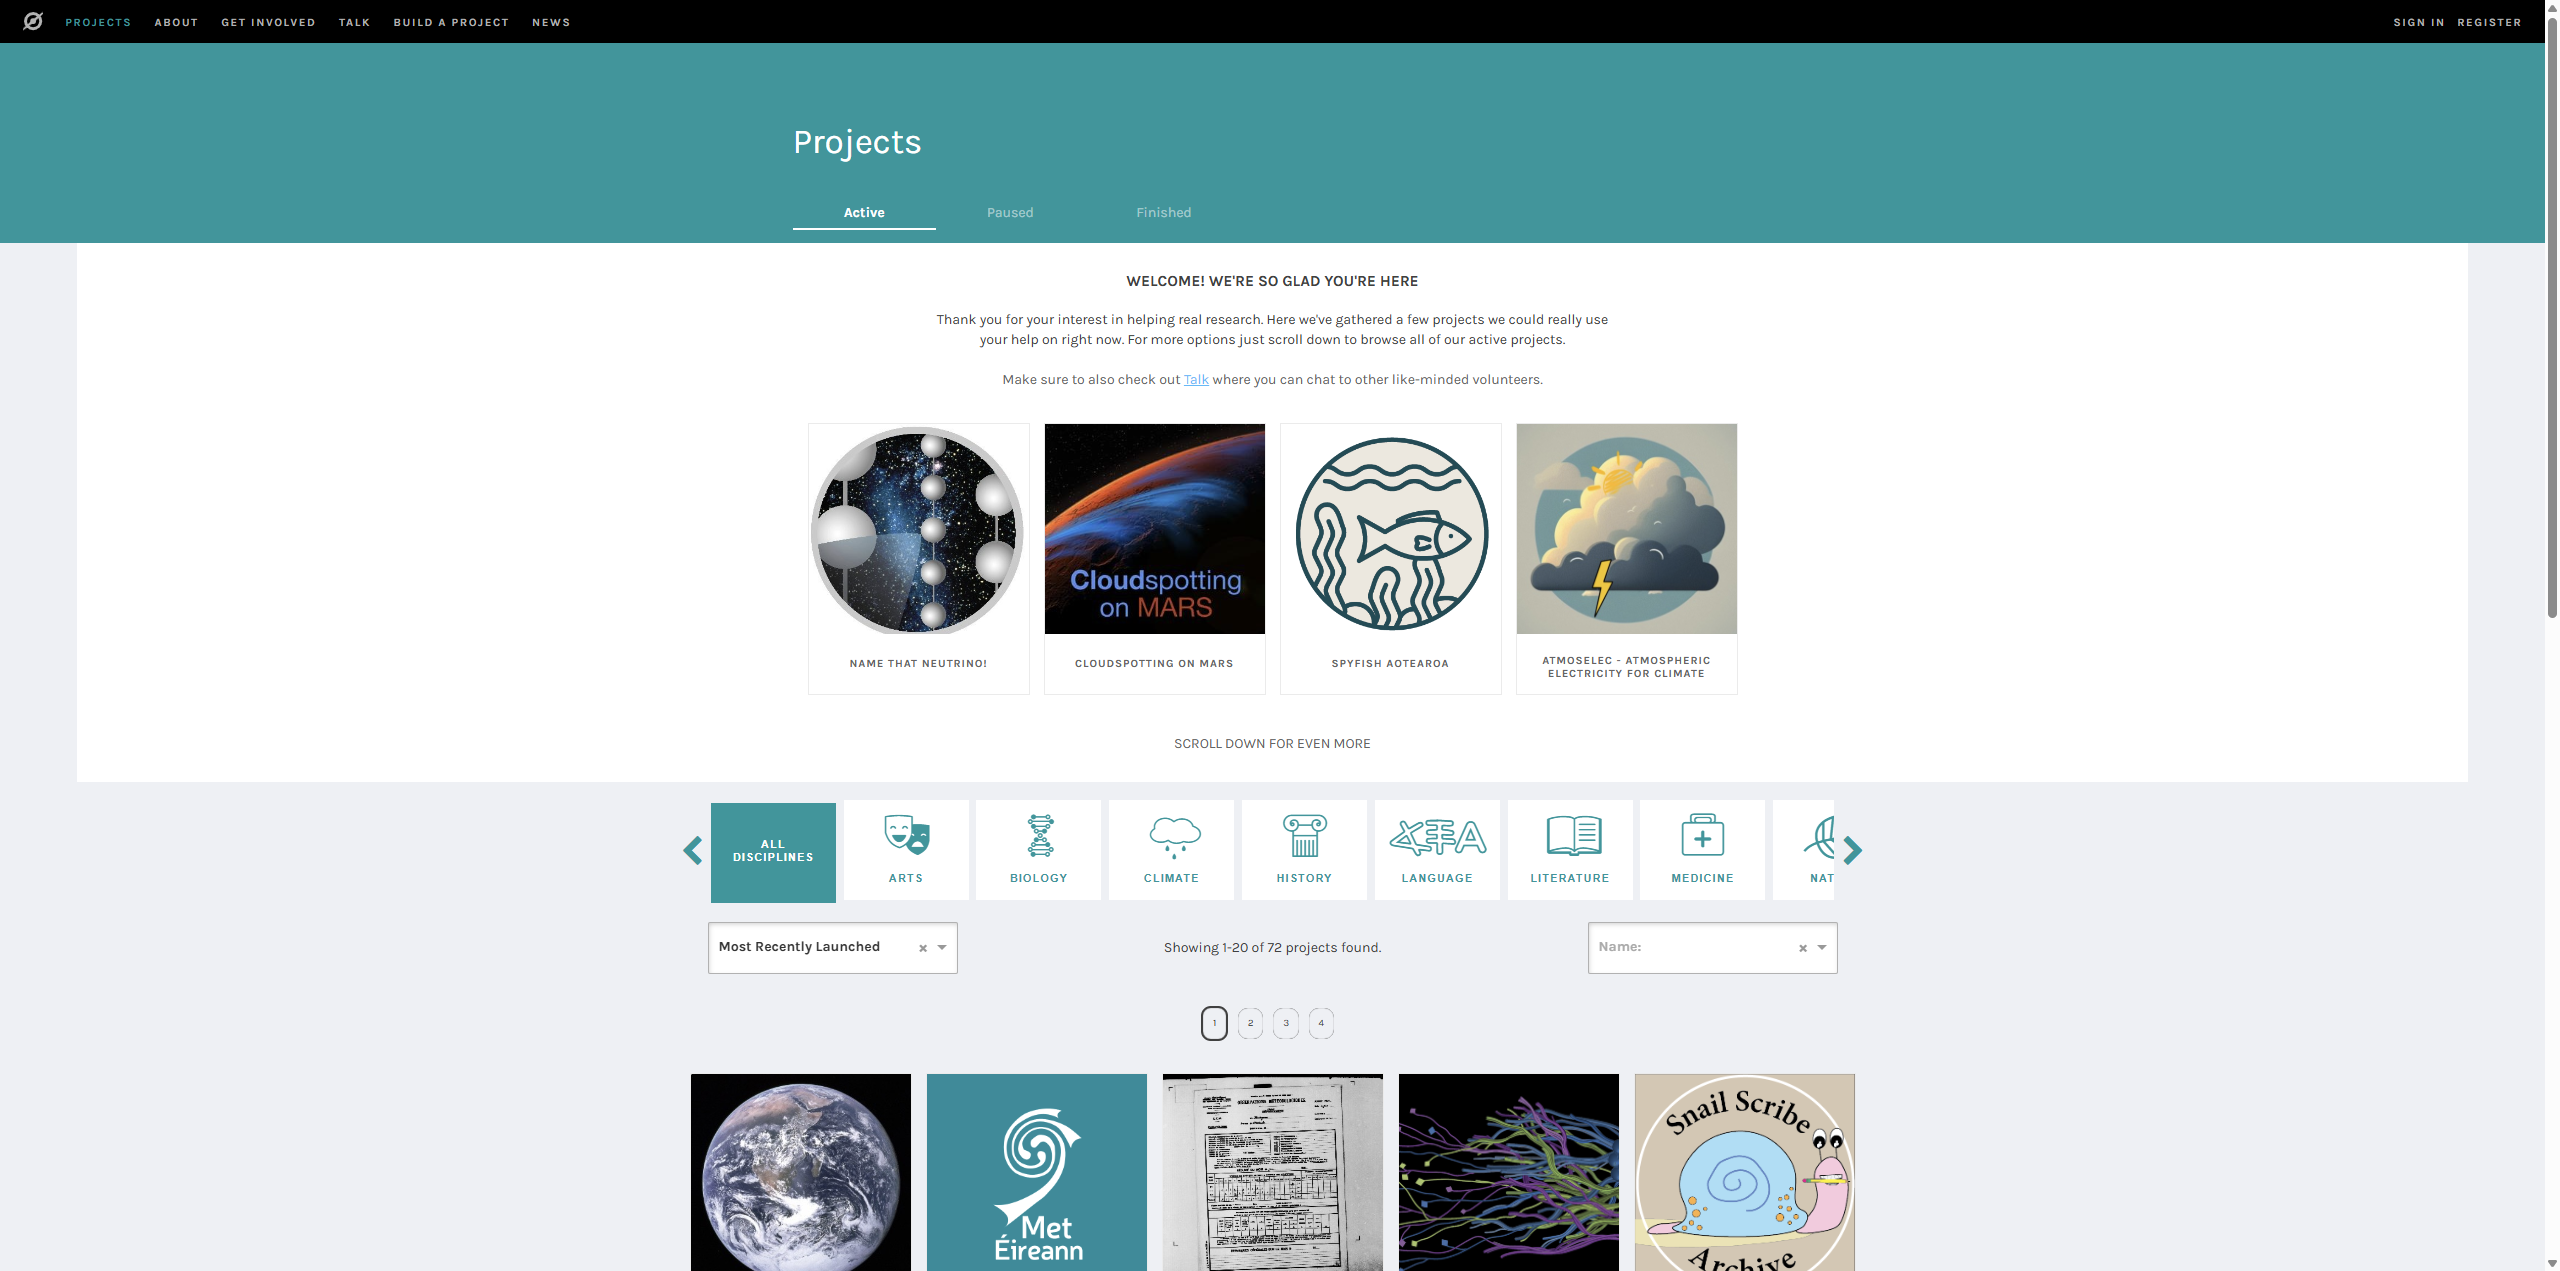
- Here is the link of the webpage in part 2: https://www.zooniverse.org/projects
- In Figma (design file), create a simple wireframe to demonstrate your improved interface (it doesn’t need to look visually as good as a real webpage, though feel free to try if you wish. The minimum requirement is that we can at least understand your basic layout, similar to the simple prototype you drew in Lab 08).
What to Report:
- The proposed design changes with explanation on why your group believes that those design changes are warranted
- Your suggested new design (prototype) that you’ve decided on through consensus
Part 04: Applied Reflection: Connecting Eye‑Tracking Insights to Your Final Project
This final part encourages you to reflect on how the eye‑tracking and visualization explored in this 9 might inform or inspire your final project work or your own project work.
Tasks:
In a paragraph (approximately 200–300 words), respond to the following guiding question as a group:
- How could the concepts of eye‑tracking, attention distribution, or heatmap visualization contribute to your final project design, evaluation, or data analysis?
- Can you envision an element of your project where visual attention plays a critical role?
- Do you see future opportunities to use eye‑tracking tools or gaze data in your own research or professional practice? If not, feel free to state why.
- If there is some future opportunities, what type of problem or scenario would benefit most from this technology?
What to Report:
In the final section of your report, you will need to provide responses to the questions posed above:
- Answers to questions in a paragraph [group]
Some inspiration for your reference
- Application - Uncover Gaze Behaviour on Phones: https://docs.pupil-labs.com/alpha-lab/phone-neon/#uncover-gaze-behaviour-on-phone-screens-with-neon
- Comprehensive aticle about current eyetracking: https://link-springer-com.ezaccess.libraries.psu.edu/article/10.3758/s13428-024-02590-2
- An Interesting Study on Eye Tracking in Interface Interaction (Video Available): https://userinterfaces.aalto.fi/ueyeschi23/
- Open source eye-tracking software - PyGaze : https://www.pygaze.org/about/
How is my lab graded?
What do I need to submit and what format?
- Your group should submit a group python notebook (colab file)
- Rememeber that all the individual work requires individial blocks of each member for those tasks/parts of the lab.
- Modify your document access permissions and submit a shared link for this file.
- Give both of your TAs and Dr. Dancy edit access
- Although you’re using Colab, you don’t need to run any code within it (we’ve run your code in VS code). However, using a python notebook helps you submit a neat report that’s well suited for a mix of code and text, and that is more straightforward for the us to review.
| Graded item | Points |
|---|---|
| Part1 | 8 pts |
| Part2 | 8 pts |
| Part3 | 8 pts |
| Part4 | 8 pts |
| Well organized and can easily see each member’s effort | 4 pts |
Total points possible: 36 pts
Drafted by Winnie Fang and modified by Chris Dancy